

Every popunder campaign report leads with the same number: click-through rate. It’s the metric platforms surface first, the one that’s easiest to compare across campaigns, and the one most affiliates check before anything else. The problem is that CTR only tells you whether someone’s browser triggered your ad, not whether that person converted, not whether you’re overpaying for the traffic you’re winning, and not whether your budget is actually being spent where it performs best.
Popunder traffic in particular rewards a closer look. Because the ad loads behind the active tab rather than requiring a direct click on the creative itself, “click-through rate” in a pop campaign already measures something slightly different than it does on a banner or native placement. That’s not a flaw in the format, it just means CTR alone was never built to tell the whole performance story here.
This guide walks through five metrics that fill in what CTR leaves out: post-click conversion rate, CPA by zone, view-through conversions, frequency, and win-rate-adjusted CPM. Together, they show where a campaign is actually making money, where budget is quietly being wasted, and what to adjust first, turning a surface-level report into a real optimization plan.
TL;DR
CTR shows interest, not performance. The five metrics that actually reveal how a popunder campaign is doing are: post-click conversion rate, CPA by zone, view-through conversions, frequency, and win-rate-adjusted CPM. Tracking these together lets affiliates find where budget is working, where it’s being wasted, and where bids need adjusting, instead of chasing click volume that doesn’t convert. Below, each metric is broken down with what it measures, why it matters specifically for popunder traffic, and how to act on it.
Why Isn’t CTR Enough on Its Own?
CTR measures interest in the popunder itself, not interest in the offer behind it. A campaign can post a strong CTR and still lose money if the landing page, GEO, or offer isn’t the right match for that traffic.
This gap is especially pronounced with popunder inventory. Because a popunder opens in a new window behind the active tab, the “click” that generates the impression isn’t really a click on your ad, it’s a click somewhere else on the publisher’s page that happens to trigger the popunder. That means CTR in popunder campaigns already behaves differently than CTR on a banner or native placement: it reflects publisher page activity as much as it reflects interest in your specific offer.
This is one of the most common reasons affiliates misread a popunder campaign’s real performance; they see a CTR that looks healthy by pop-format standards and assume the campaign is working, without checking what happens after that impression fires.
The five metrics below exist specifically to answer the question CTR can’t: is this campaign actually making money, and where?
What Is Post-Click Conversion Rate?
Post-click conversion rate is the percentage of clicks that turn into completed conversions – the metric that actually reflects whether traffic and offer are a good fit. A high CTR paired with a low conversion rate almost always points to a landing page or GEO mismatch, not a traffic quality problem.
Segment conversion rate by:
- Source or zone ID: some zones consistently send users who convert; others send volume that never does
- GEO: the same offer can convert at very different rates across tier-1 vs. tier-2/3 GEOs, even with similar CTR
- Device type: popunder traffic often skews heavily toward one device type depending on the publisher mix, and conversion rate frequently diverges sharply between mobile and desktop for the same offer
If clicks are strong but conversions aren’t following, the fix is rarely “get more clicks.” It’s usually one of a few specific issues:
- Landing page load speed: popunder traffic is often impatient traffic; a slow-loading page loses users before the offer even displays
- Offer-GEO mismatch: an offer that converts in one GEO can underperform elsewhere even with identical creative and comparable CTR
- Pre-lander relevance: if you’re using a pre-lander, it needs to bridge naturally from what the user was doing on the publisher page to the offer, or you lose them at that transition
A practical benchmark: if conversion rate on a zone sits meaningfully below your campaign average for more than a few days of stable volume, that’s a strong candidate for pausing or renegotiating the bid, regardless of what its CTR looks like.
Why Does CPA by Zone Matter More Than Average CPA?
Blended CPA hides where your budget is actually performing, because popunder traffic is pulled from a wide pool of publisher zones with very different performance. A small group of zones often drives most conversions while the rest quietly burn spend.
This is arguably the single highest-leverage metric on this list, because it’s the one most directly tied to where your money goes. An affiliate looking only at campaign-wide CPA might see a number that looks acceptable overall, while missing that 70% of that spend is coming from zones performing well below target, subsidized by a handful of strong zones carrying the rest.
Pull CPA by zone ID on a weekly basis and work through a simple triage:
- Lower bids or pause zones running well above target CPA, especially once they’ve had enough volume to be statistically meaningful (a zone with 3 clicks and 0 conversions isn’t a verdict, a zone with 300 clicks and 1 conversion is)
- Raise bids on zones consistently beating target CPA, to capture more volume from what’s already working
- Whitelist top performers once you have enough data volume to trust the numbers, and consider building a dedicated whitelist-only campaign once you’ve identified a strong pool of zones
One thing worth flagging for affiliates newer to popunder: zone performance isn’t static. A zone that performs well for a nutra offer in one GEO won’t necessarily perform the same way for a finance offer in another. Re-run this zone-level review any time you launch a new offer or shift verticals, don’t assume last month’s whitelist carries over automatically.
What Are View-Through Conversions?
View-through conversions are conversions that happen after a user sees an impression but doesn’t click through immediately; common with popunder traffic, since the ad loads behind the active browser window rather than requiring an active click to engage.
This is a structural quirk of the format worth understanding: a popunder sits behind the user’s active tab until they close or minimize what they’re doing. Some users notice it immediately; others don’t see it until later in their session, or come back to it after finishing whatever they were originally doing. Either way, the resulting conversion may not be tied to an immediate click in your tracker, but it’s still a conversion your campaign generated.
If tracking only counts click-based conversions, real campaign performance is likely being underreported, sometimes significantly. This matters most for offers with a slightly longer consideration window; financial products, higher-ticket nutra, or anything requiring a form fill rather than a single tap.
Setting up view-through tracking closes that gap:
- Fire a pixel on impression (not just on click)
- Attach a conversion window (commonly 24 hours for pop traffic, though this varies by vertical; test what fits your offer)
- Compare total attributed conversions (click + view-through) against click-only numbers to see how much volume you were missing
If the gap between click-only and full attribution is large, it’s a strong signal that your campaign is performing better than click-based reporting alone suggests, and that scaling decisions based on click data alone may be too conservative.
How Does Frequency Affect Popunder Performance?
Frequency is the average number of times a unique user sees your ad, and uncapped frequency quietly drives up cost while performance declines. Without a cap, the same users see the same creative repeatedly, and returns diminish while spend keeps climbing.
This happens for a predictable reason: the first exposure to an offer has the highest chance of conversion. Every additional exposure to the same user, with the same creative, converts at a lower marginal rate, while still costing the same per impression. Left unchecked, a campaign can end up spending a growing share of its budget on users who have already decided not to convert.
Watch for these warning signs:
- CTR or conversion rate dropping over a campaign’s lifespan with the same creative running unchanged
- Rising CPA alongside flat or falling unique reach; a sign that spend is increasingly going toward repeat impressions rather than new users
The fix is usually simple and often underused: a modest frequency cap per zone (1–3 impressions per user per day is a reasonable starting point) frequently improves campaign economics more than a bid adjustment does, because it redirects spend toward fresh impressions instead of diminishing-return repeats.
Frequency also interacts with creative fatigue. If you’re capping frequency but still seeing performance decline over time, that’s usually a sign it’s time to rotate creative rather than a targeting problem.
What Is Win-Rate-Adjusted CPM?
Win rate shows whether your bid is actually competitive for the traffic you’re targeting, and win-rate-adjusted CPM shows what you’re really paying once wins are factored in, not just your max bid. A low win rate at a given bid usually signals under-bidding for that GEO/vertical, not a lack of available traffic.
This metric answers a question affiliates often skip past: is my bid actually winning the auctions I want to win? A campaign can be configured correctly, right GEO, right vertical, right creative, and still underperform simply because the bid is too low to consistently win impressions in a competitive segment.
Track win rate alongside effective CPM (what you’re actually paying per thousand impressions after wins, not your max bid) to make an informed call:
- Low win rate + effective CPM well under market rate → you’re likely under-bidding; raising the bid should unlock more volume without a proportional cost increase
- High win rate + effective CPM near or above market rate → you’re already paying close to what the segment is worth; further bid increases will mostly just raise cost, not volume
This is where affiliates most often either leave volume on the table (bidding too conservatively) or overpay (bidding aggressively without checking whether win rate justifies it). Reviewing this weekly alongside CPA by zone gives a much clearer picture of whether bid changes are actually warranted.
How Do These Metrics Work Together?
None of these five metrics tells the full story alone, they’re diagnostic in combination:
- Strong CTR + weak conversion rate → landing page or GEO/offer mismatch, not a traffic problem
- Good average CPA + wide variance in CPA by zone → budget is being propped up by a few strong zones; time to whitelist and cut
- Click-based conversions look weak but view-through data tells a different story → the campaign is likely underperforming on paper, not in reality – expand attribution before pulling budget
- Rising CPA + flat reach → frequency issue, not a bidding issue, cap before you raise bids
- Low win rate + CPM under market → bidding issue, not a creative or offer issue, adjust bid before touching anything else
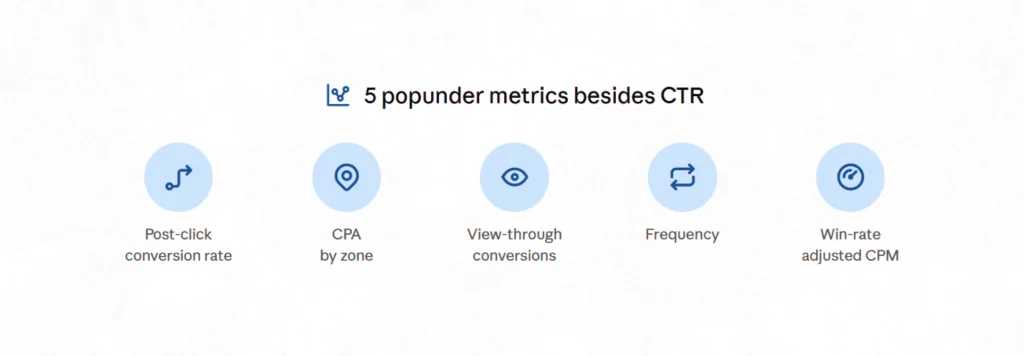
Running through this order, conversion rate, then zone CPA, then attribution, then frequency, then win rate, gives a logical diagnostic path instead of guessing at what to change first.
A Simple Weekly Tracking Routine
For affiliates managing active popunder campaigns, a lightweight weekly routine covering all five metrics looks like this:
- Pull zone-level CPA and flag zones above/below target
- Check conversion rate by GEO and device for any sudden shifts
- Compare click-only vs. full attribution (click + view-through) to confirm click data isn’t understating performance
- Review frequency distribution and adjust caps if repeat exposure is climbing
- Check win rate and effective CPM to decide whether bids need adjusting up or down
Ten to fifteen minutes a week against this checklist catches most of the performance drift that would otherwise go unnoticed until a monthly report shows a disappointing number with no clear cause.
Comparison: The 5 Metrics at a Glance
| Metric | What It Measures | Why It Matters for Popunder | Where to Find It |
|---|---|---|---|
| Post-click conversion rate | Clicks that become conversions | Reveals landing page/offer fit | Tracker, segmented by zone/GEO/device |
| CPA by zone | Cost per acquisition per publisher zone | Shows where budget is actually working | Ad network zone reports |
| View-through conversions | Conversions after impression, no click | Captures the full popunder conversion path | Impression pixel + conversion window |
| Frequency | Avg. impressions per unique user | Flags rising cost from repeat exposure | Ad network frequency reports |
| Win-rate-adjusted CPM | Real cost per 1,000 after win rate | Shows if bids are under- or over-priced | Bid vs. win-rate reports |
FAQ
Is CTR a bad metric to track?
No, CTR is still useful as a top-of-funnel signal, especially for spotting creative issues early. The problem is treating it as a verdict on campaign performance instead of pairing it with conversion and cost metrics.
How often should I check CPA by zone?
Weekly is a good baseline for most campaign volumes. High-spend campaigns, or campaigns in an active scaling phase, benefit from checking every 2-3 days.
What frequency cap should I start with?
1-3 impressions per user per day is a reasonable starting point, then adjust based on how conversion rate and CPA respond over the following week.
Why would click-based and view-through numbers differ so much?
Because popunders load behind the active tab, some users convert after closing or returning to the window later rather than clicking immediately. The gap is usually larger for offers with a longer decision process, like financial products.
Should I whitelist zones immediately after one good day?
No, wait for enough volume to be statistically meaningful. A single strong day can be noise; a consistent pattern over a week or more is a much stronger signal.
Ready to put these metrics to work?

Join Popcash and start optimizing your popunder campaigns with real zone-level data.
